
Laboratory electron screening in nuclear resonance reactions
Atomic electrons can impact nuclear reaction measurements because their charge screens the Coulomb potential of the interacting nuclei. Both nonresonant and resonance reaction data are subject to such laboratory electron screening effects. For nonresonant reactions, such effects are well documented and the measured cross sections can be corrected to find the unscreened ones. Frequently, the procedure and expression to calculate laboratory electron screening factors for nonresonant reactions are also applied to isolated narrow resonances, without much theoretical support or experimental evidence. A simple model is applied to estimate electron screening factors, lengths, and potentials for narrow resonances. The corrections to the measured data result in an enhancement of the unscreened resonance strengths by less than 0.2%, contrary to published narrow-resonance screening correction factors, which predict a reduction of the unscreened strengths by up to 25%. The prospects of investigating laboratory electron screening effects by measuring almost negligible differences in resonance strengths are not promising. Instead, the difference of the resonance energy for the unscreened and screened situation may be measurable. As an example, the case of the Er = 956-keV resonance in the 27Al(p,γ)28Si reaction is discussed.
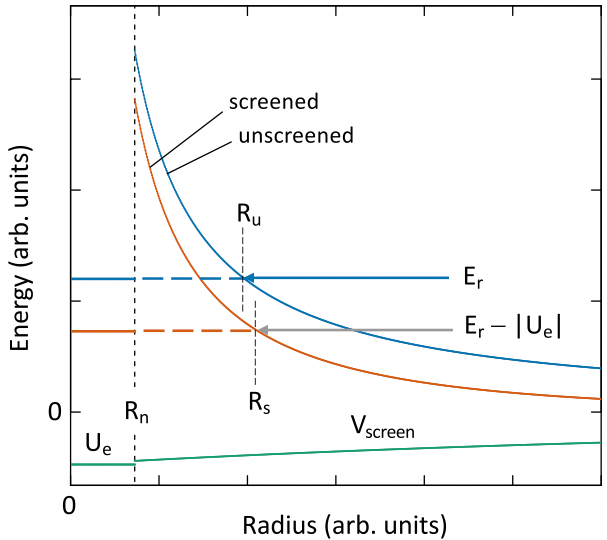
The figure depicts electron screening for a resonance in the laboratory, showing the unscreened Coulomb potential (blue curve); negative screening potential (green); screened Coulomb potential (red curve); resonance energy, Er (blue arrow); and shifted energy (gray arrow); Rn denotes the nuclear radius, Ru is the classical turning point at energy Er for the unscreened barrier, and Rs is the turning point at energy Er − |Ue| for the screened barrier. The actual reaction in the laboratory is represented by the gray arrow and the red curve. Notice that the tunneling distance, Rs −Rn, through the screened barrier at energy Er − |Ue| is larger than the distance Ru − Rn through the unscreened barrier at Er. If the screening potential, Vscreen, would be constant, then the tunneling distances would be the same and no change in either the transmission coefficient or resonance strength would be expected. For more information, see Iliadis, PRC 107, 044610 (2023).
The 16O(p,gamma)17F reaction is the slowest hydrogen-burning process in the CNO mass region. Its thermonuclear rate sensitively impacts predictions of oxygen isotopic ratios in a number of astrophysical sites, including AGB stars. The reaction has been measured several times at low bombarding energies using a variety of techniques. The most recent evaluated experimental rates have a reported uncertainty of about 7.5% below 1 GK. However, the previous rate estimate represents a best guess only and was not based on rigorous statistical methods. We applied a Bayesian model to fit all reliable 16O(p,gamma)17F cross section data, and take into account independent contributions of statistical and systematic uncertainties. The nuclear reaction model employed is a single-particle potential model involving a Woods-Saxon potential for generating the radial bound state wave function. The model has three physical parameters, the radius and diffuseness of the Woods-Saxon potential, and the asymptotic normalization coefficients (ANCs) of the final bound state in 17F. We find that performing the Bayesian S-factor fit using ANCs as scaling parameters has a distinct advantage over adopting spectroscopic factors instead. Based on these results, we present the first statistically rigorous estimation of experimental 16O(p,gamma)17F reaction rates, with uncertainties (±4.2%) of about half the previously reported values.
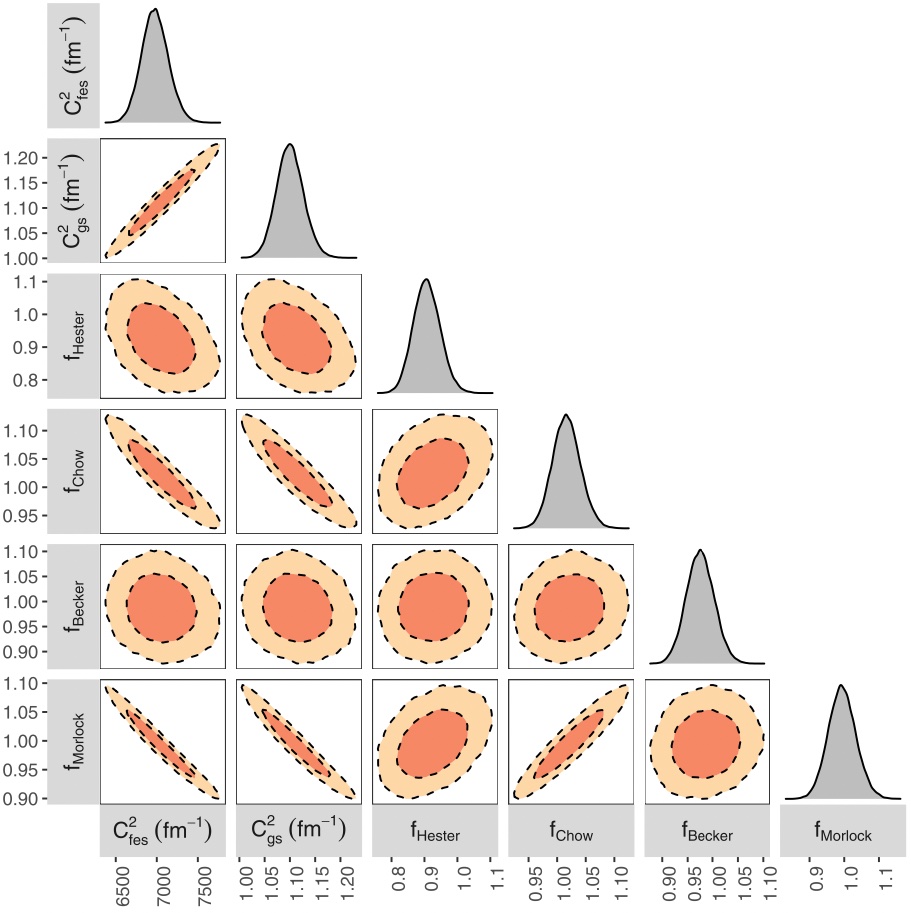
The figure depicts one- and two-dimensional projections of the posterior probability distributions of two physical model parameters (the ANCs of the ground and first-excited state in 17F) and four data set parameters (f), when adopting broad priors in the Bayesian fit. The dark and light shaded areas correspond to 68% and 95% coverage probabilities, respectively. For more information, see Iliadis, Palanivelrajan & de Souza, PRC 106, 055802 (2022). Vimal Palanivelrajan is a UNC undergraduate student.
Linear polarization–direction correlations in gamma-ray scattering experiments.
Scattering measurements with incident linearly polarized gamma rays provide information on spins, parities, and gamma-ray multipolarity mixing coefficients, and, therefore, on the nuclear matrix elements involved in the transitions. We present the general formalism for analyzing the observed angular correlations. The expressions are used to compute three-dimensional radiation patterns, which are important tools for optimizing experimental setups. Frequently, gamma-ray transitions can proceed via two multipolarities that mix coherently. In such cases, the relative phases of the nuclear matrix elements are important when comparing results from different measurements. We discuss different phase conventions that have been used in the literature and present their relationships. Finally, we propose a basic experimental geometry consisting of detectors located at four different spatial locations. For this geometry, we present the measured anisotropies of the emitted gamma rays in graphical format as an aid in the data analysis.
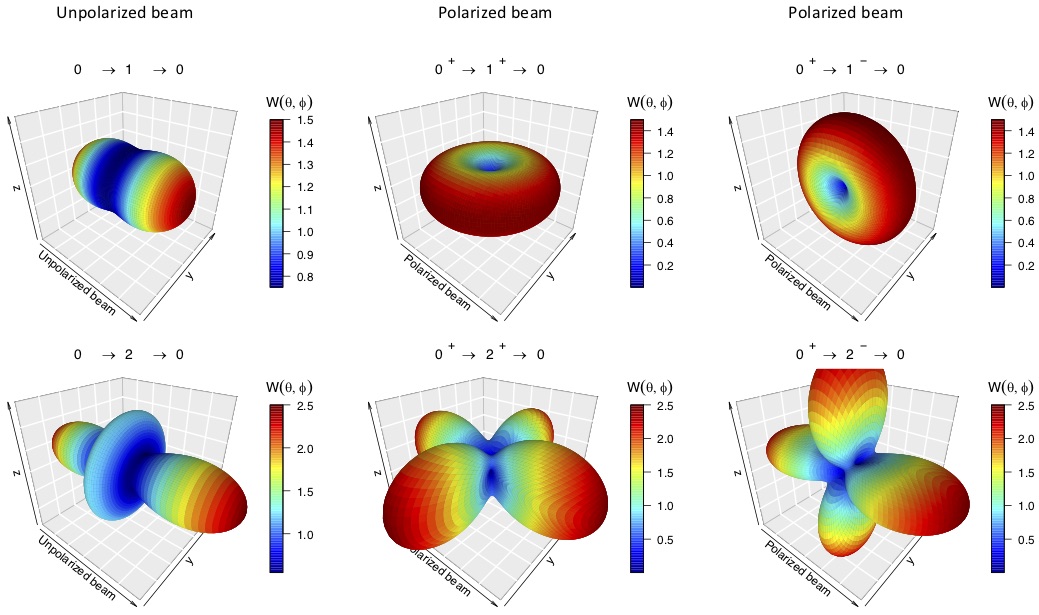
The figure shows examples for angular correlations when an unpolarized (two panels on the left) or linearly polarized (four panels on the right) gamma-ray beam is incident on zero-spin target nuclei. The beam moves along the positive z-direction. The target is located in the center of each pattern. Target nuclei absorb photons from the beam to form an excited level of given spin and parity. The excited level decays back to the target ground state by emission of gamma rays. The 3D patterns depict the spacial intensity pattern of the emitted gamma-rays, revealing distinct angular correlations. Notice that the shapes of the patterns depend on the spin-parity of the excited level and on the presence or absence of beam polarization in the experiment. For more information, see Iliadis and Friman-Gayer, Eur. Phys. J. A, 57, 190 (2021).
Calculation of resonance energies from Q values.
Resonance energies are frequently derived from precisely measured excitation energies and reaction Q values. The latter quantities are usually calculated from atomic instead of nuclear mass differences. This procedure disregards the energy shift caused by the difference in the total electron binding energies before and after the interaction. Assuming that the interacting nuclei in a stellar plasma are fully ionized, this energy shift can have a significant effect, considering that the resonance energy enters exponentially into the expression for the narrow- resonance thermonuclear reaction rates. As an example, the rate of the 36Ar(p,gamma)37K reaction is discussed, which, at temperatures below 1 GK, depends only on the contributions of a single resonance and direct capture. In this case, disregarding the energy shift caused by the total electron binding energy difference erroneously enhances the rate by about 40% near temperatures of 70 MK.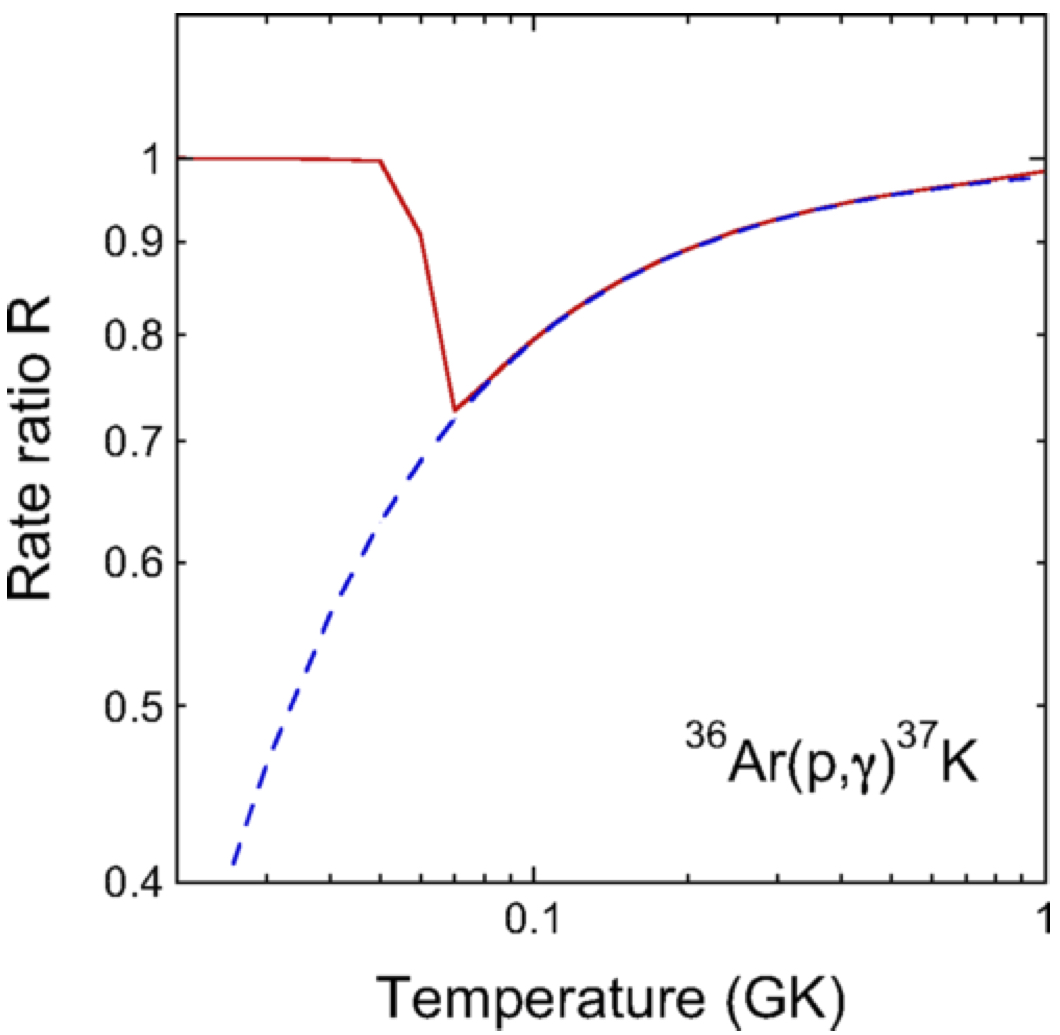
The figure shows the ratio of 36Ar(p,gamma)37K reaction rates obtained with nuclear masses and atomic masses for calculating the center-of-mass resonance energy. (Solid line) Rate ratio that takes all resonant and nonresonant contributions into account. (Dashed line) Rate ratio for the Ecm = 315 keV resonance alone, according to the expression R = exp(−0.0230/T9 ). For more information, see Iliadis, Phys. Rev. C 99, 065809 (2019).